A common mistake among construction teams in Mackay is assuming the subsurface is uniform across the coastal plain. The region’s complex geology — alluvial deposits overlying weathered volcanics and metasediments — creates sharp velocity contrasts that standard boreholes can miss entirely. Seismic tomography (refraction/reflection) resolves this by generating continuous 2D velocity profiles down to 30–50 m depth, mapping bedrock topography and identifying paleochannels before foundation design. We combine this technique with MASW-VS30 surveys to constrain shear-wave velocity for site classification per AS 1170.4, ensuring the seismic design parameters reflect actual ground conditions rather than assumed profiles.
Seismic tomography in Mackay's coastal geology catches velocity inversions and buried channels that single boreholes regularly miss.
Methodology and scope
Field acquisition uses a 24–48 channel seismograph with 4.5 Hz geophones spaced at 2–5 m intervals, coupled with a sledgehammer or accelerated weight drop source. For Mackay’s sandy coastal soils and stiff clay horizons, we typically deploy 115 m spreads for refraction and longer offsets for CMP reflection processing. The crew records 12–24 shot points per line to capture both direct arrivals and refracted head waves. Key deliverables include:
P-wave velocity tomograms with 1–2 m resolution
Reflector geometry from CDP stacking
Depth to engineering bedrock (Vs > 760 m/s)
Data inversion uses nonlinear traveltime tomography (e.g., Geogiga or SeisImager). We cross-check results against georadar GPR profiles when shallow void detection is critical.
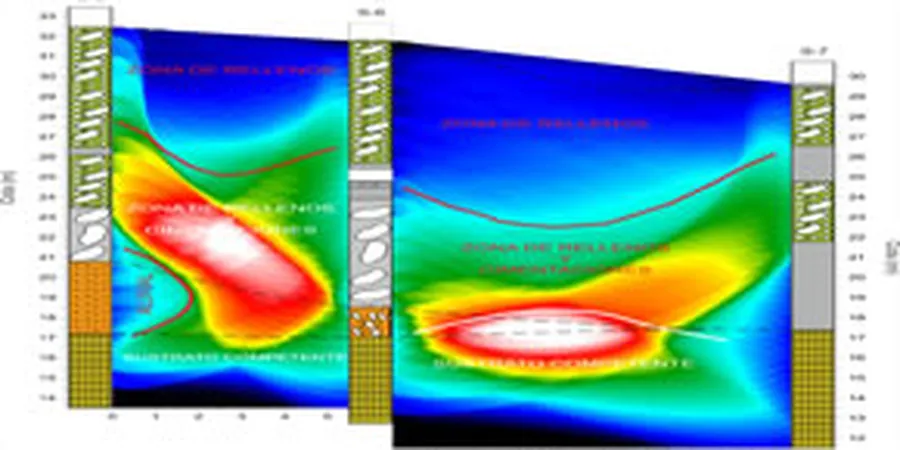
Technical reference image — Mackay
Local considerations
In Mackay, many developers rely solely on CPT or SPT soundings spaced 30–50 m apart. That’s insufficient where the contact between alluvium and basement dips steeply or where paleochannels filled with loose sands exist. We’ve seen cases in the Outer Harbour area where a 6 m thick soft layer appeared in one borehole but pinched out laterally within 20 m — seismic tomography caught the lateral transition that a single boring would have labelled as uniform. Ignoring these velocity anomalies leads to differential settlement or underestimating liquefaction potential in loose zones. A refraction/reflection survey adds lateral continuity to any point-based investigation.
High-resolution P-wave velocity profiles for defining top-of-rock elevations, detecting weathered zones, and locating faults or shear zones. Ideal for bridge foundations and wharf construction in the harbour precinct.
02
Reflection Profiling for Stratigraphic Imaging
CDP-stacked reflection sections that resolve dipping beds, buried channels, and layer boundaries. Used for tailings dam site assessments and large earthworks where layer continuity is critical.
03
Combined MASW + Refraction for Site Class
Simultaneous acquisition of surface-wave dispersion (MASW) and refraction traveltimes to derive both Vs30 and Vp30. Directly applicable to AS 1170.4 site classification and liquefaction triggering analysis.
Applicable standards
AS 1170.4-2007 (Earthquake actions — Site classification via Vs30), AS 1726-2017 (Geotechnical site investigations — Seismic methods), AS 1289 (Standard Guide for Using the Seismic-Reflection Method for Shallow Subsurface Investigation), NEHRP Recommended Provisions (Site Class A–F based on Vs30)
Frequently asked questions
How deep can seismic tomography investigate in Mackay's coastal soils?
Refraction tomography typically resolves structures down to 40–60 m in Mackay’s alluvial and estuarine deposits. Reflection profiling can image deeper (80–120 m) if the target reflector has sufficient acoustic impedance contrast. We adjust spread length and source energy based on target depth.
What is the cost range for a seismic tomography survey in Mackay?
For a standard 2–4 line project (200–400 m total spread), the cost typically ranges from AU$3,980 to AU$7,480 depending on line length, source type, and reporting requirements. Additional mobilization for remote sites or heavy vegetation may apply.
How does seismic tomography compare to boreholes for site classification?
Boreholes give point-specific data; seismic tomography provides continuous 2D velocity profiles across the entire site. For AS 1170.4 site classification, we need Vs30 — tomography combined with MASW yields a continuous Vs profile, while boreholes only sample at discrete depths. The two methods are complementary, not interchangeable.
Can seismic tomography detect liquefiable layers in Mackay?
Indirectly, yes. Low P-wave velocities (< 1500 m/s) in saturated zones suggest loose, potentially liquefiable sands. When combined with CPT or SPT data for calibration, the velocity sections help map lateral extent of suspect layers. We routinely integrate tomography with CPT soundings for liquefaction assessment.